
On the Central Bank of Libya's own page on the history of exchange-rate policy there is a line most readers pass over. When the Libyan ‘‘pound’’ was issued in 1952, it was defined as 2.488 grams of gold. Not a dollar price; a weight of metal.
I took that old definition and applied it to the last thirty years, 1996 to today, to see what comes out.
The reason for choosing gold rather than the dollar is that the dollar has itself moved a great deal over the period, and measuring the dinar against it alone gives an answer that depends on which year you choose to start from. Gold is not a perfect yardstick. It rises and falls for reasons that have nothing to do with Libya. But that is precisely what makes it useful: what gold did can be separated from what the dinar did.
The arithmetic is simple. Divide the dinar's dollar value by the dollar price of a gram of gold in the same year, and you get the grams of gold one dinar bought. Then value those grams at today's price, about $138 a gram. This answers the saver's question: someone who turned a dinar into gold in a given year, what do they hold now?
But it charges the dinar with gold's rise, which every currency suffered. So, I added a second calculation that takes the dinar's dollar value in that year and divides it by today's gold price rather than that year's. The second number measures the dinar alone.
In both cases I worked with two rates: the official one and the market one. The official rate on its own produces a picture unrecognisable to anyone who lived in Libya in the 1990s, when the official dollar cost less than half a dinar and the dollar people actually bought cost more than three. Market rates before 2015 are not recorded in any official series, so the figures here are estimates of annual averages, with a margin of error that does not change the conclusion.
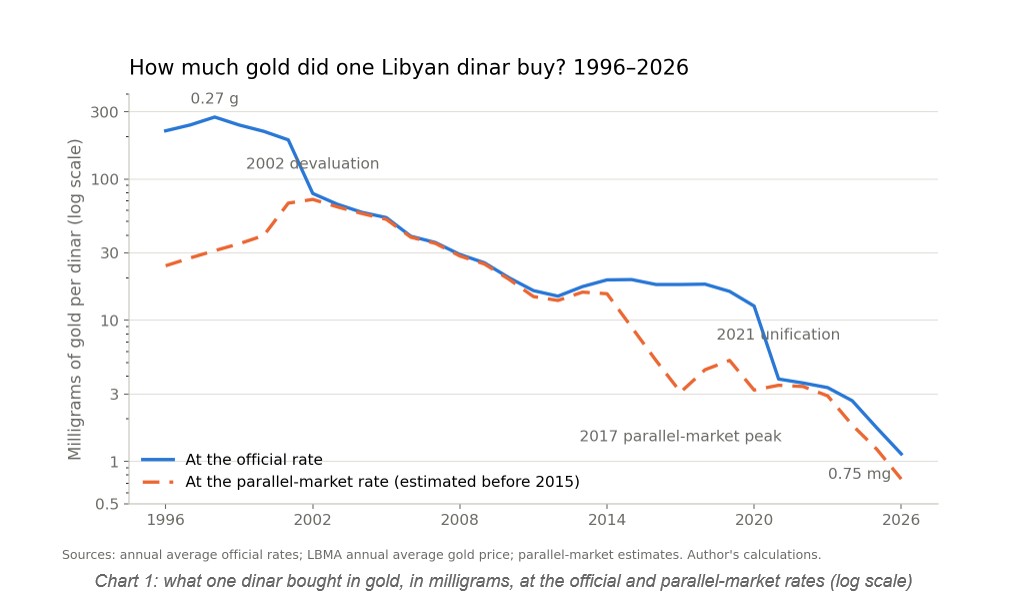
The two lines tell different stories about the 1990s, then converge in 2002 and stay together until 2014. That is no accident. The 2002 devaluation brought the official rate down to roughly where the market was, and the gap disappeared. Over the following twelve years the dinar's gold content fell from about 70 milligrams to about 15, but its dollar price did not move; it stayed around 1.3 throughout. The entire decline came from gold, which rose from $300 to $1,600.
The second divergence began in 2015 and peaked in 2017, when the dollar passed eight dinars on the street with the official rate still at 1.39. That year the market dinar bought about three milligrams, close to what it buys today. Then came the 183 per cent levy on foreign-currency sales in September 2018, and the unification of the rate at 4.48 in January 2021, and the lines drew together for three years.
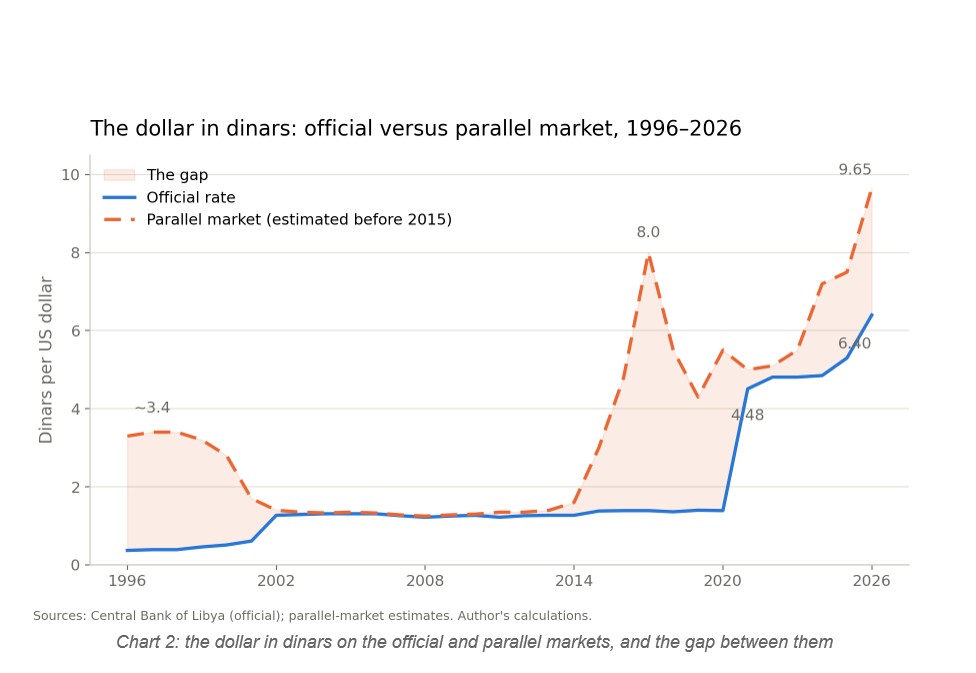
Since 2024 the gap has been widening again, despite two official devaluations: April 2025, and January 2026, when the dinar was cut 14.7 per cent to 0.1150 SDR. The official rate today is 6.40 and the market 9.65, a distance of fifty per cent. The chart shows something worth dwelling on: every official devaluation since 2021 has narrowed the gap for a few months, after which it reopened, each time from a higher dollar.
The numbers for selected years:
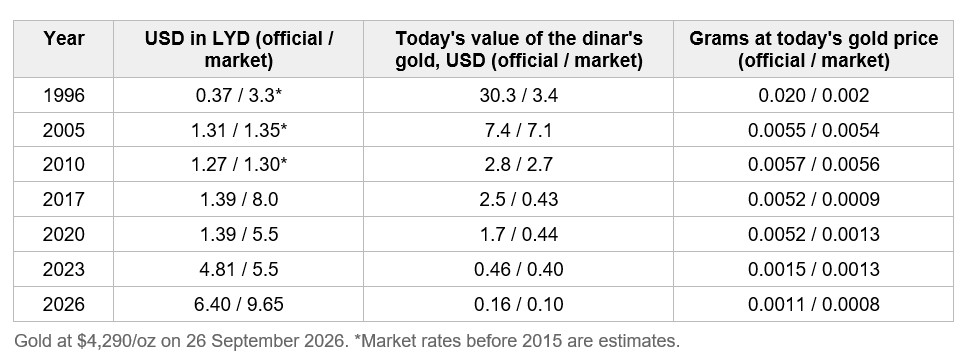
Four different results can be pulled from this table depending on method and rate, and all four are arithmetically correct. By the first method at the official rate, the dinar has lost 99.5 per cent of its gold value since 1996. By the first method at the market rate, 97 per cent. By the second method at the official rate, 94 per cent. By the second method at the market rate, 66 per cent.
The last figure is the one I think describes the experience of an ordinary Libyan, because it excludes an official dollar which he never had access to and excludes a rise in gold the dinar had no hand in. The dinar in his pocket today is worth a third of what a 1996 dinar was worth, not one two-hundredth. The first figure, 99.5 per cent, is the one that circulates in public debate, and it is sometimes used to condemn every monetary decision since the 1990s in a single breath, even though most of it measures a spread between two rates rather than a loss of value.
But ordering the numbers by period reveals something else. At the market rate, by the second method, the dinar lost about 40 per cent between 1996 and 2020, a quarter of a century. Between 2020 and 2026 it lost another 43 per cent, in six years. Half of what the dinar has lost in thirty years, it lost in the last six, and those were years with no oil-price collapse and no prolonged export shutdown.
The revenue was there. What changed is that spending now comes from two sides (the two contesting Libyan governments in the west and east), letters of credit have become a commodity in their own right, and the central bank has been lowering the rate to catch up with the market rather than lead it.
The one period in which the dinar held its value on all four measures at once, 2003 to 2014, was not a period of a strong dinar. It was worth 77 cents. But it was worth 77 cents to everyone who held it, and there was no gap from which anyone could extract a rent. The SDR peg has not changed since 1986. What changed is everything around it.
(Note on method: official exchange rates are annual averages (Central Bank of Libya / IMF); gold prices are LBMA annual averages; parallel-market rates before 2015 are the author's estimates, thereafter from market monitoring. Full workings available on request.)
Munder Shuhumi is the founder and CEO of Sanad Credit Rating Agency, the first Libyan company to launch its services in this sector.
Op-Eds reflect the views of the authors.